
Count on us  We count for you!
Data Processing
Traffic Counts
GEOVISTA analyses, visualises, and prepares the collected data in accordance with your requirements. To this end, we use traffic technology software that has been developed specifically for this purpose. Traffic surveys are analysed using the programme KNOTEN 3.5 and 4.0 respectively. Generally, however, we utilise an internally developed software, that combines the graphic advantages of both programmes and offers further, elaborate options.The following graphic presentations are possible with our programme:
Please move the cursor on the respective images to get a larger view.
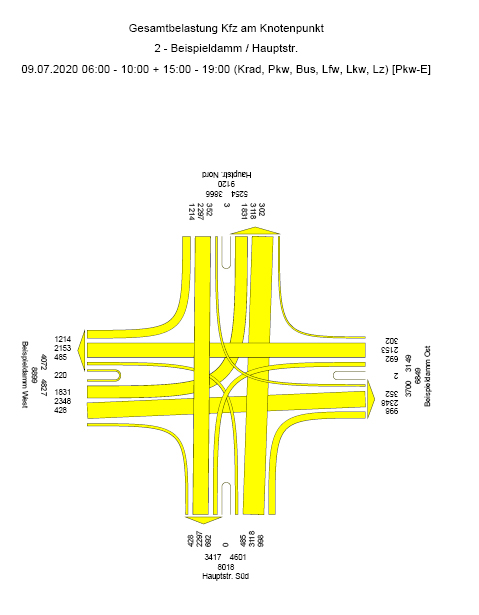
- Creation of junction flow plans for the total motor vehicle and heavy goods traffic load as well as the peak hours in the morning, daytime and afternoon.
- Preparation of bespoke analysis for select routes, vehicle types and time periods.
For example: total vehicle load - day (06:00 a.m. – 10:00 p.m.) and night (00:00 – 06:00 a.m. and 10:00 - 12:00 p.m.) - Calculation and graphic presentation of dynamic hourly loads and load curves
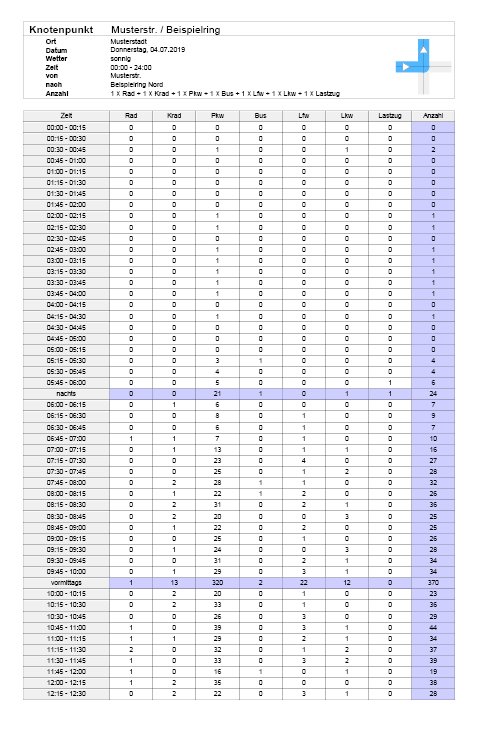
- Tabular representation of traffic flows for each route in 15 minute intervals
- Conversation in passenger car unites
- Proportion (light-duty vehicles/heavy goods traffic)
- Presentation of turning cars at a junction
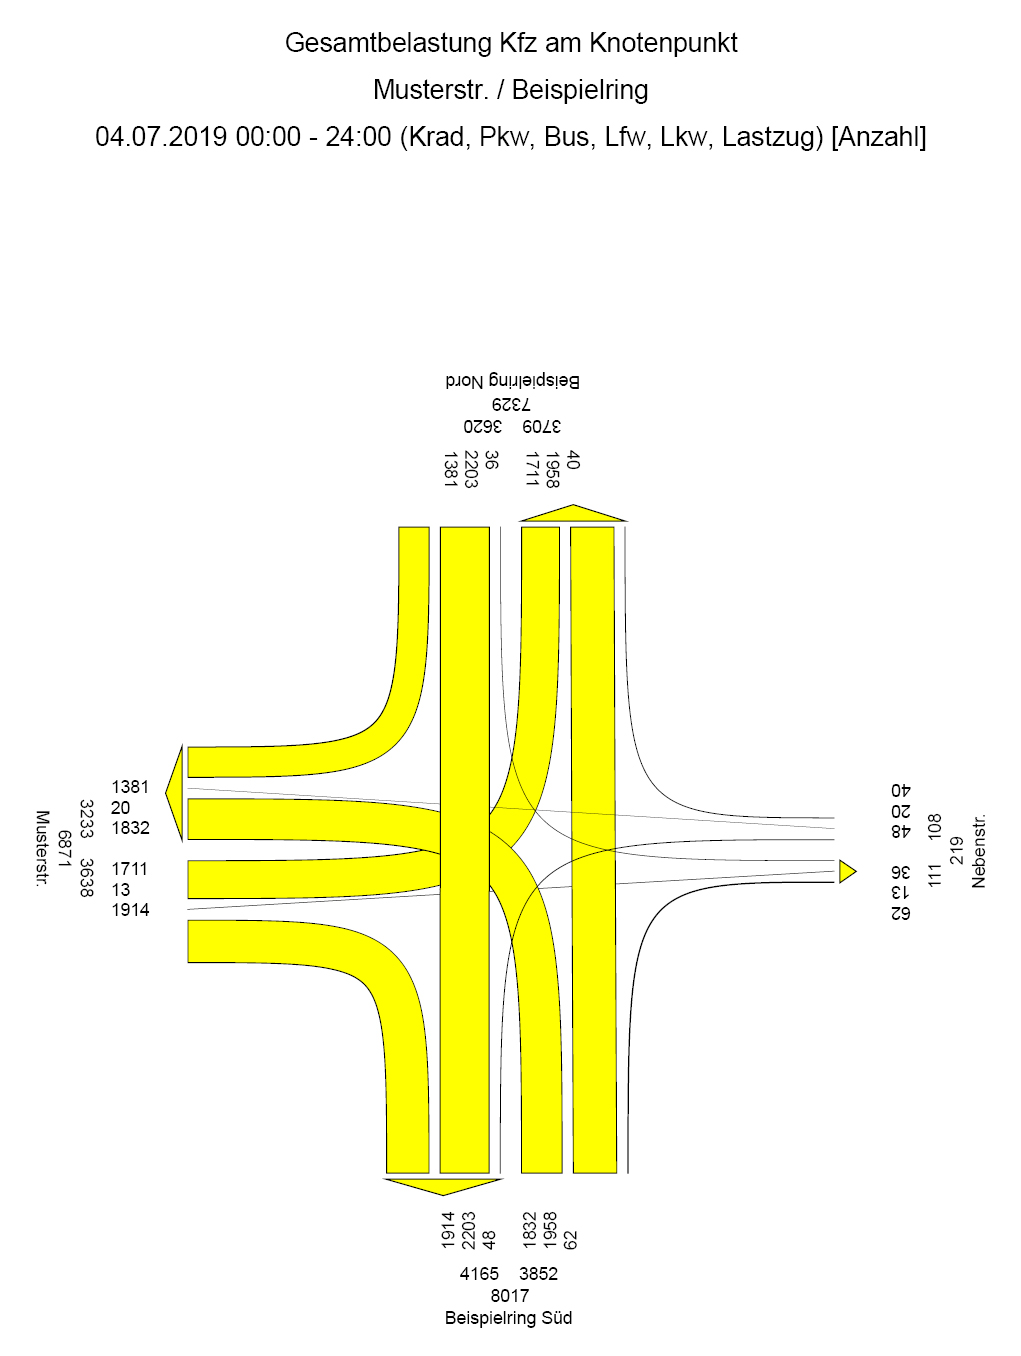
Total load
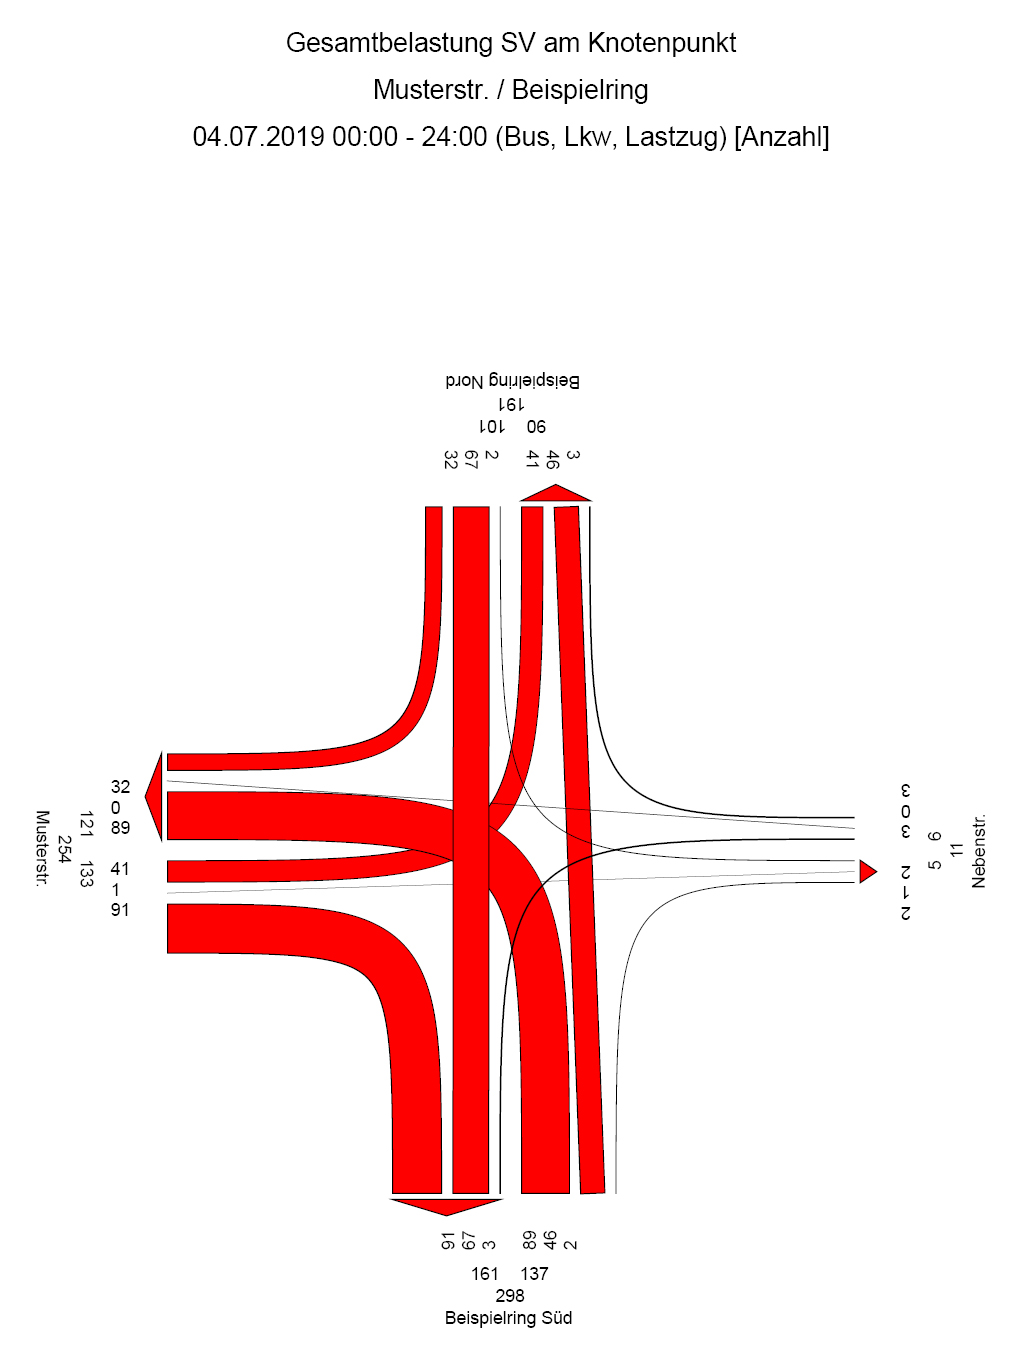 Total load - heavy goods traffic
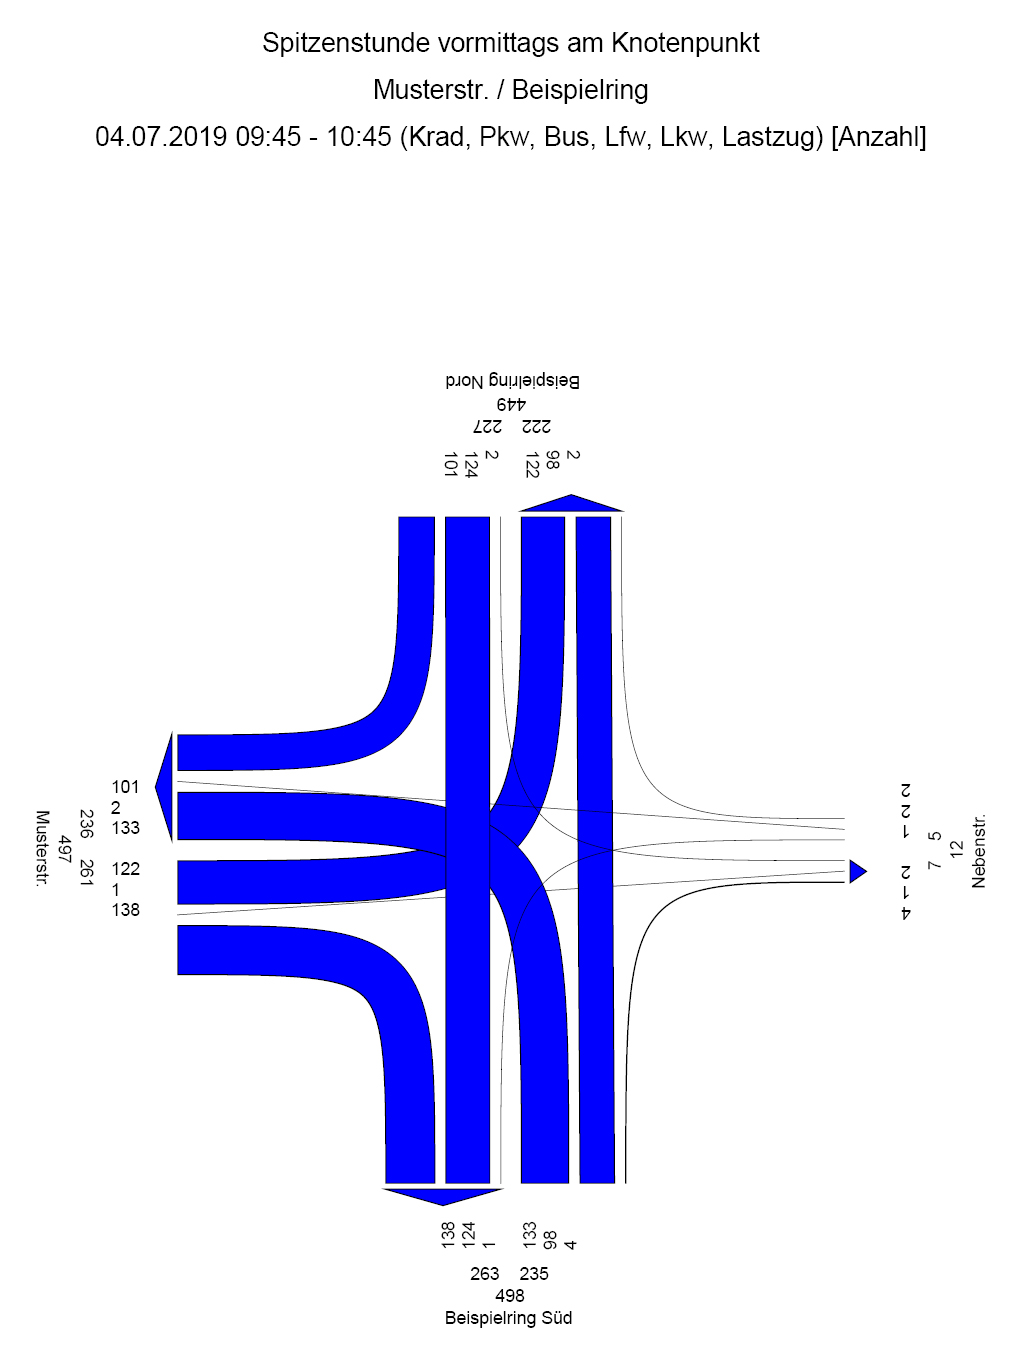 Peak hours a.m.
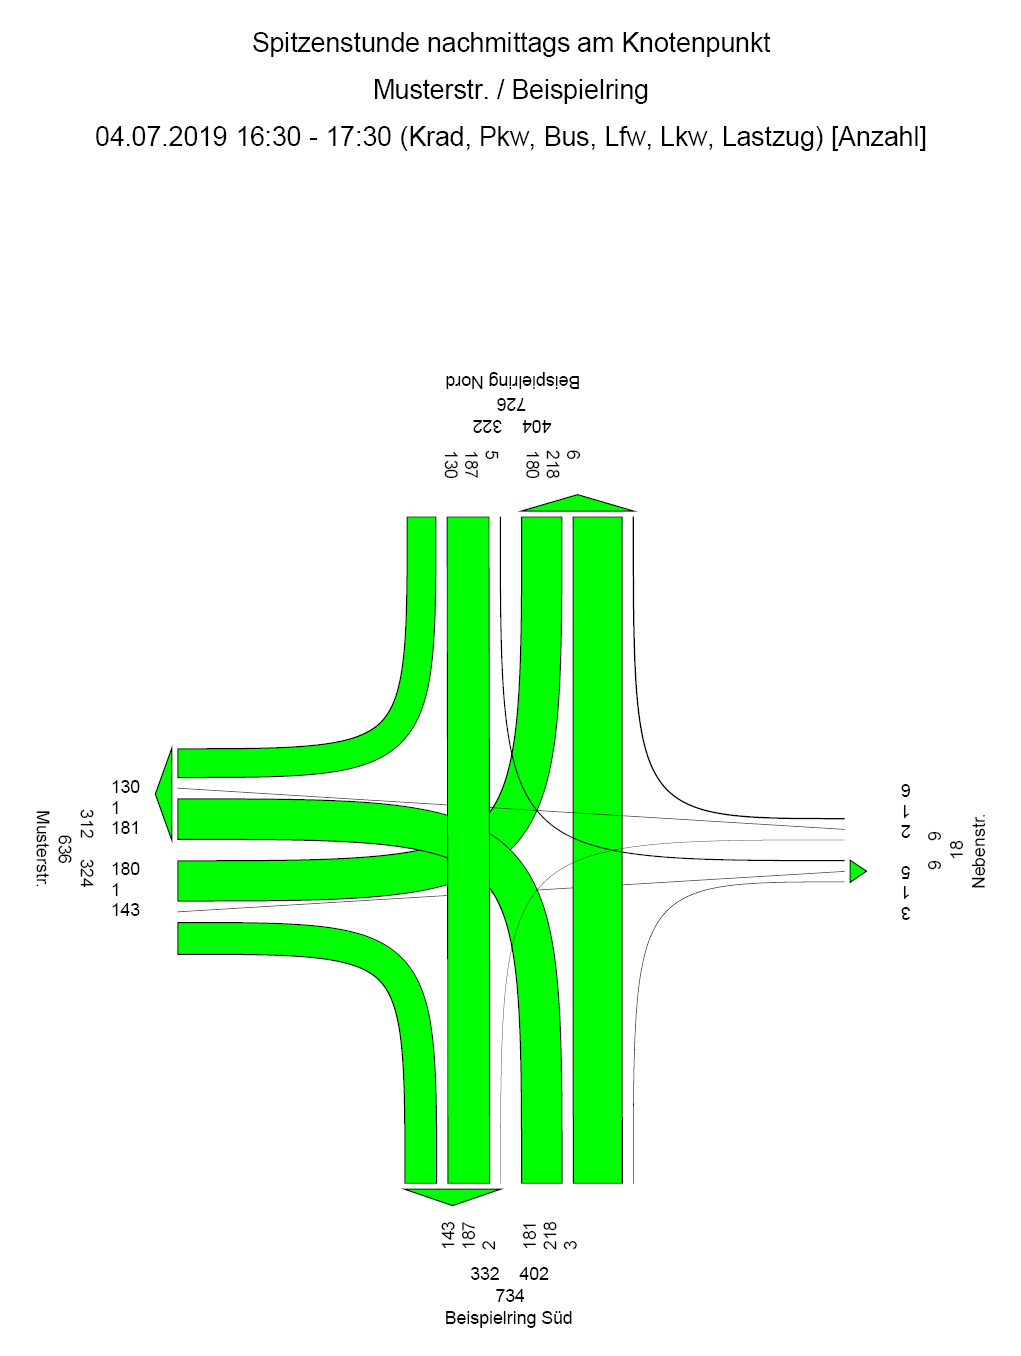 Peak hours p.m.
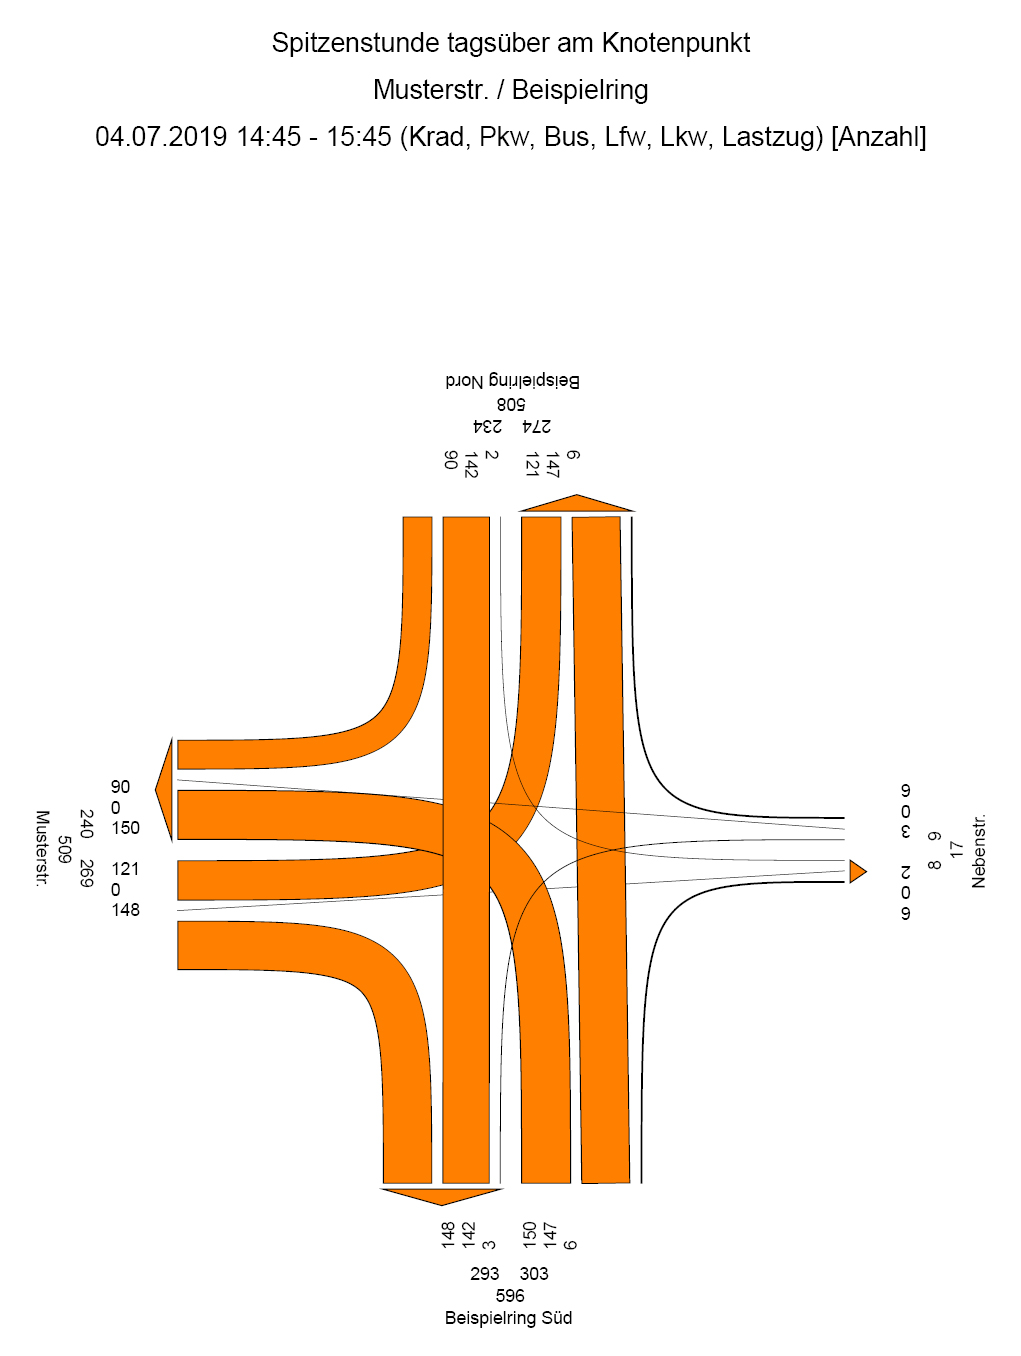 Peak hours daytime
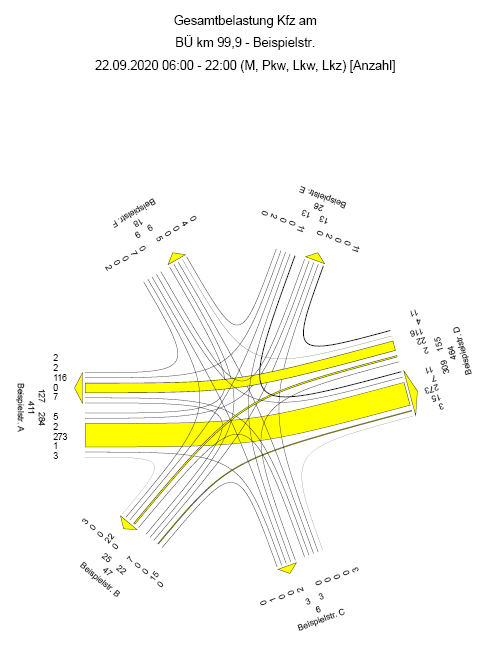
Example: junction flow plan for level crossing
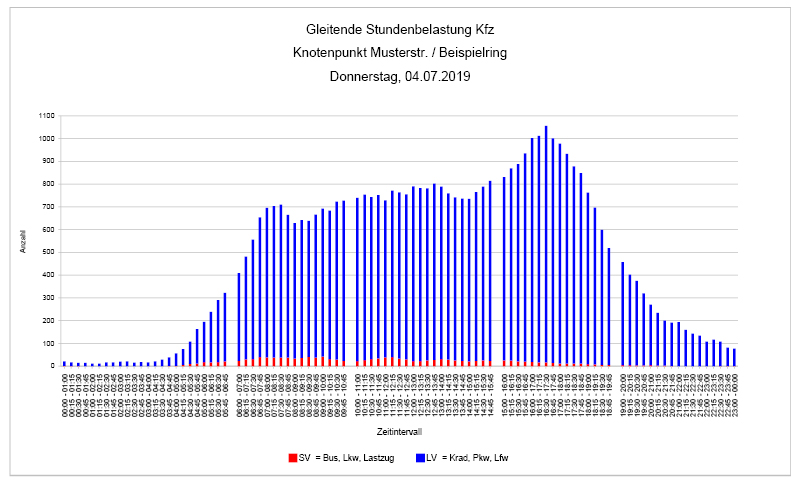
Dynamic hourly load
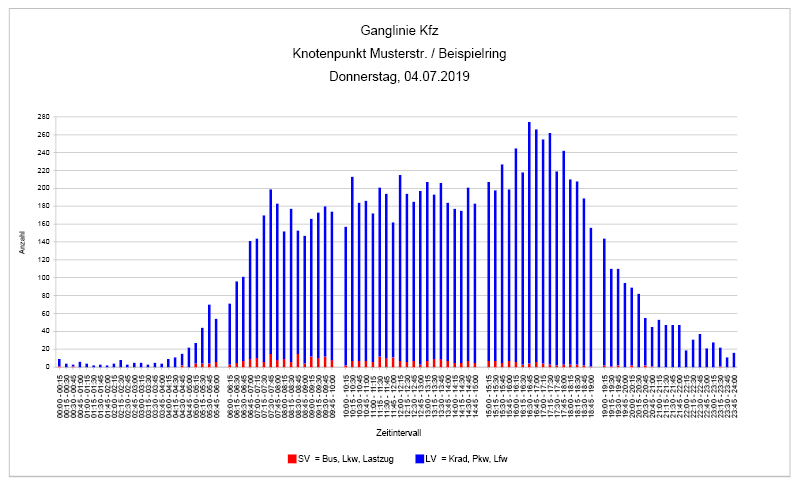
Load curve
Data sheets
Total load (PC-U)
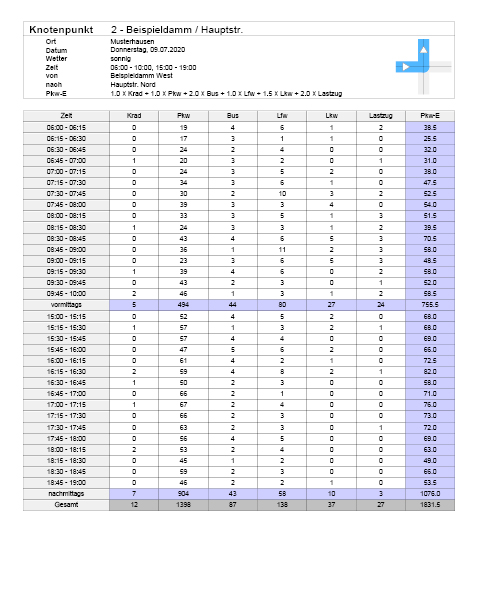
Data sheets (PC-U)
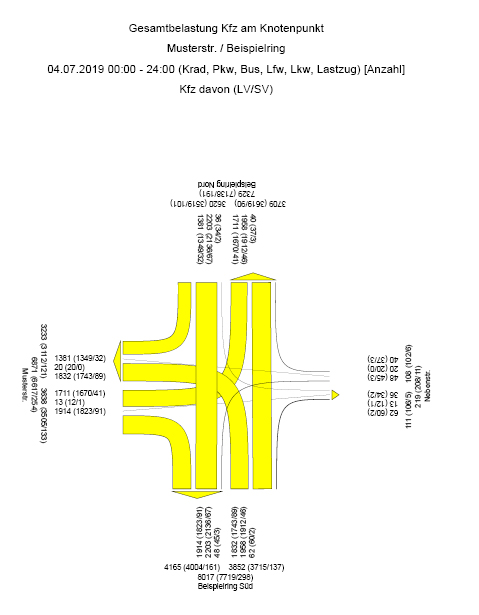
Total traffic motor vehicle - Proportion (light-duty vehicles/heavy goods traffic)
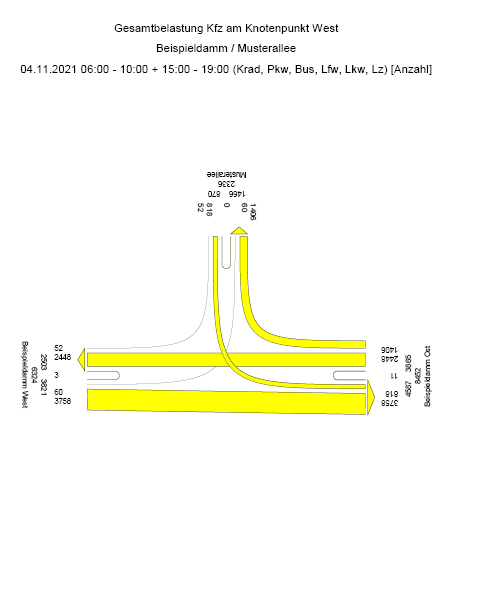
Representation of turning motor vehicles at the western intersection.
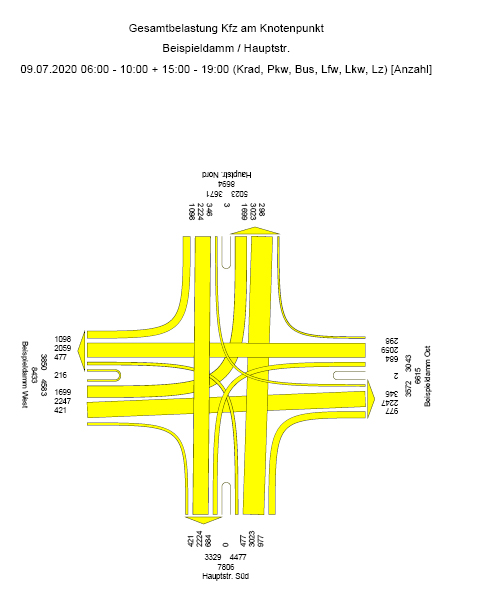
Representation of turning motor vehicles at the eastern intersection.
The Programme KREISEL is used for analysis of roundabout surveys.
It offers among others, the following options:
- Graphic representation of traffic volumes either as a roundabout or a junction
- Information on the vehicle load per arm
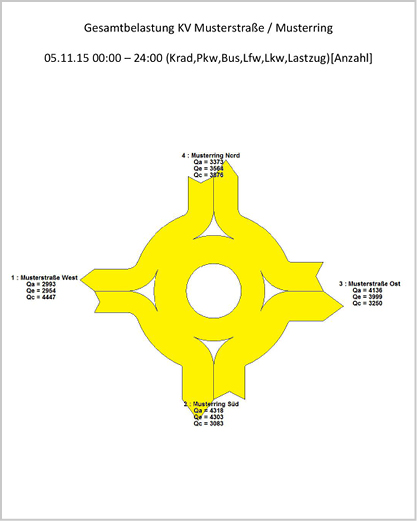 Total traffic load
 Roundabout representation
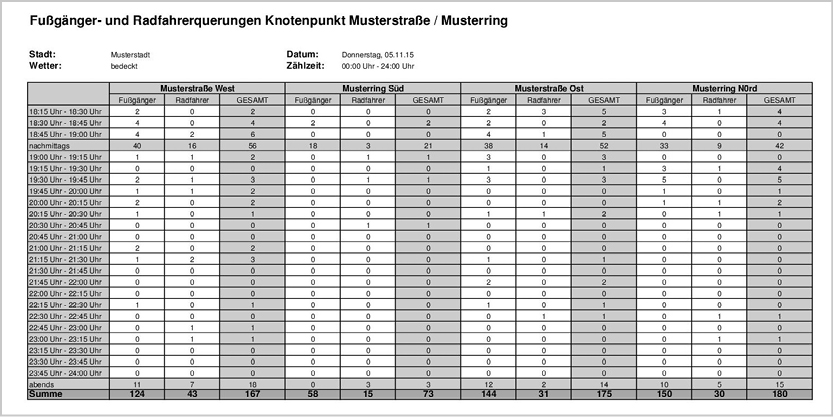 Table of pedestrian and cyclist crossings at the junction
Querschnittszählung mit Radartechnik
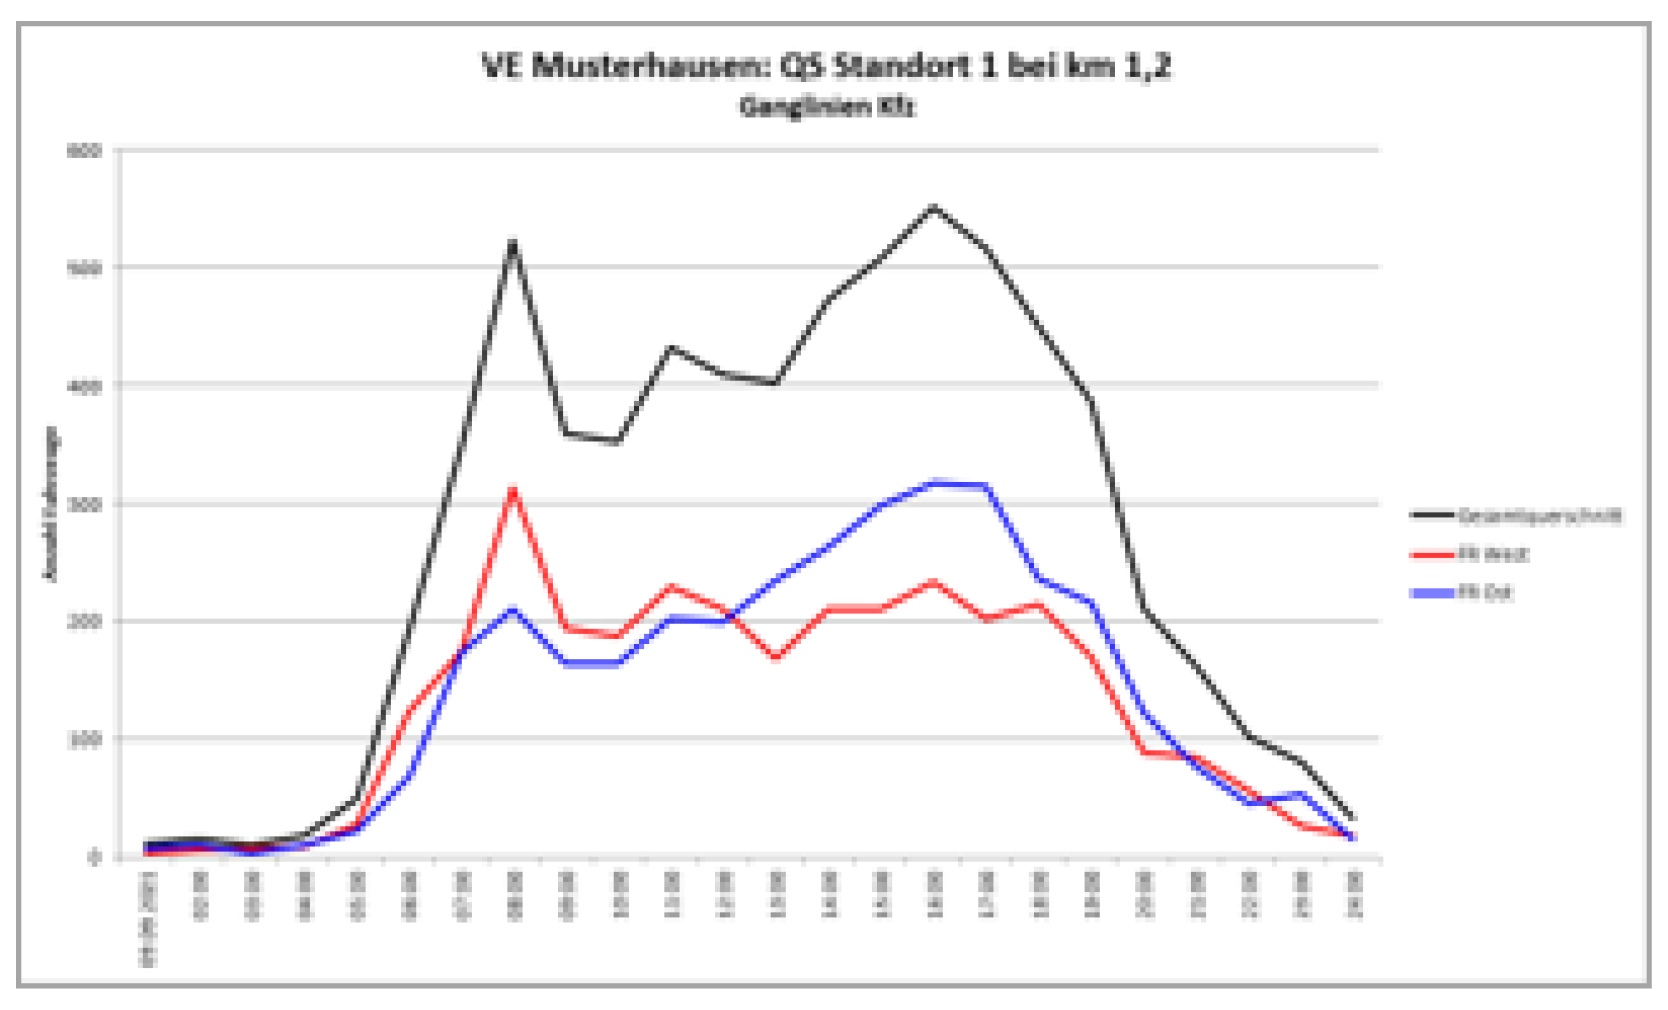
Ganglinien Kfz (Gesamtquerschnitt,
Pkw-ähnlich, Lkw-ähnlich)
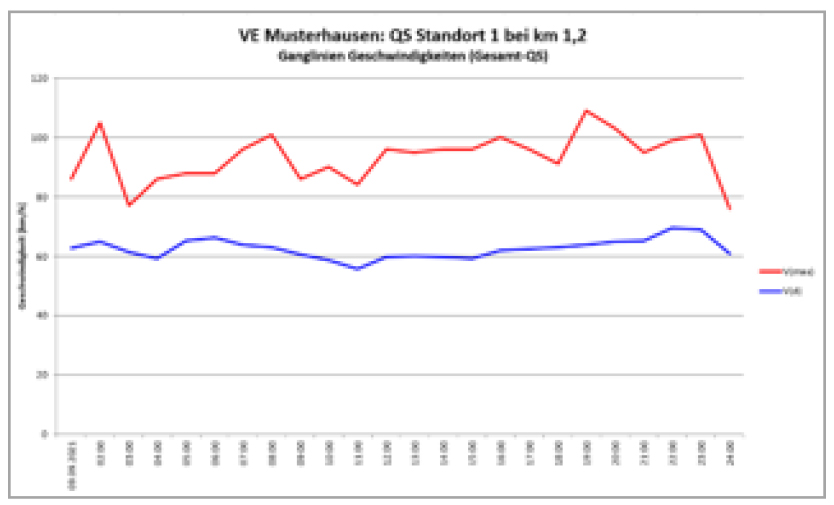
Ganglinien Geschwindigkeiten unterschieden nach V(max) und V(d)
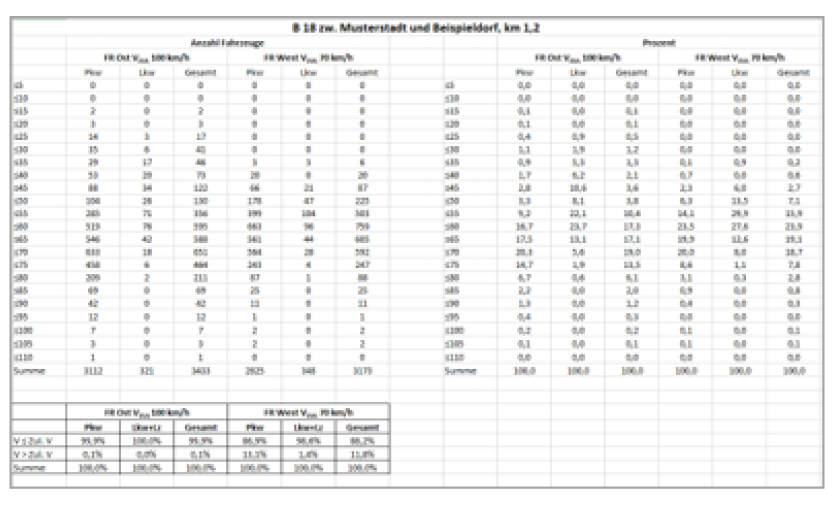
Auswertung Radarzählung nach Geschwindigkeiten je Richtung
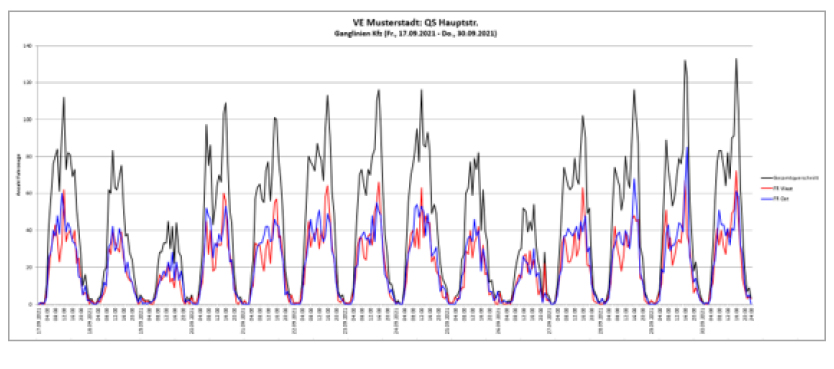
Ganglinien Kfz (Gesamtquerschnitt,
Pkw-ähnlich, Lkw-ähnlich) über einen Zeitraum von zwei Wochen

Ganglinien Geschwindigkeiten unterschieden nach V(max) und V(d) über einen Zeitraum von zwei Wochen
Traffic Monitoring
In order to evaluate accident black spots, traffic incidents and behaviour, video footage is analysed to extract the information required. All observations are recorded with a time stamp. All observations can be compiled on a DVD, SD-card or hard drive (avi format)..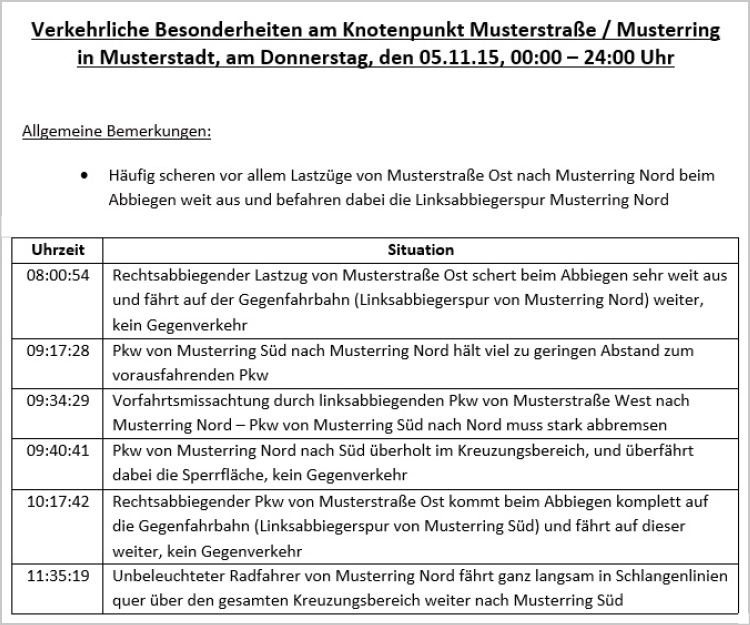 Table of traffic observations at a junction
Licence Plate Recognition
Licence plate recognition projects generally focus on determining origin, destination, and transit traffic in a specific survey area. In the course of the data processing and analysis, we initially determine the transit times between the individual count points in cooperation with the customer. Subsequently we determine the traffic relations between the individual count points and present the results in the form of a table or matrix.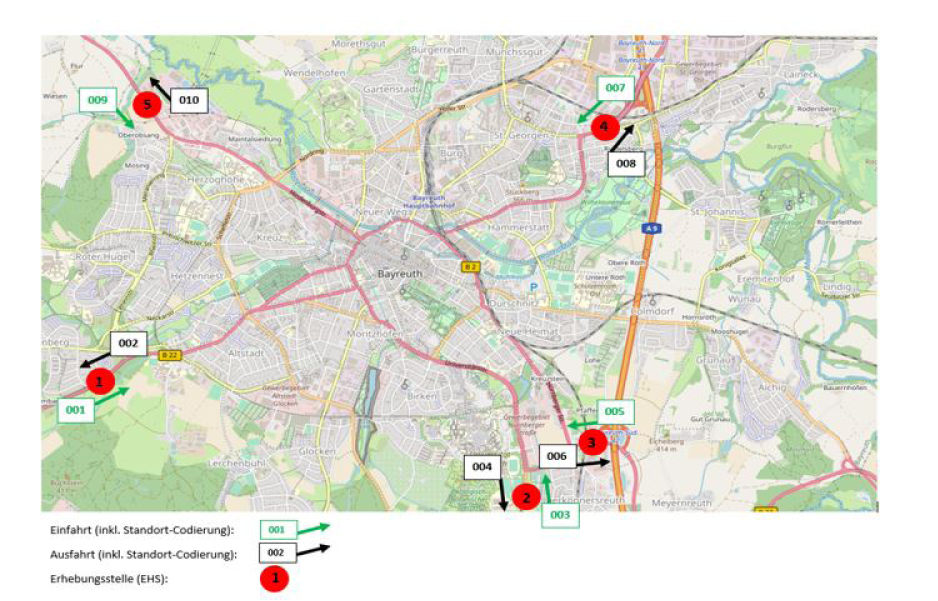 Example license plate recognition – outer cordon
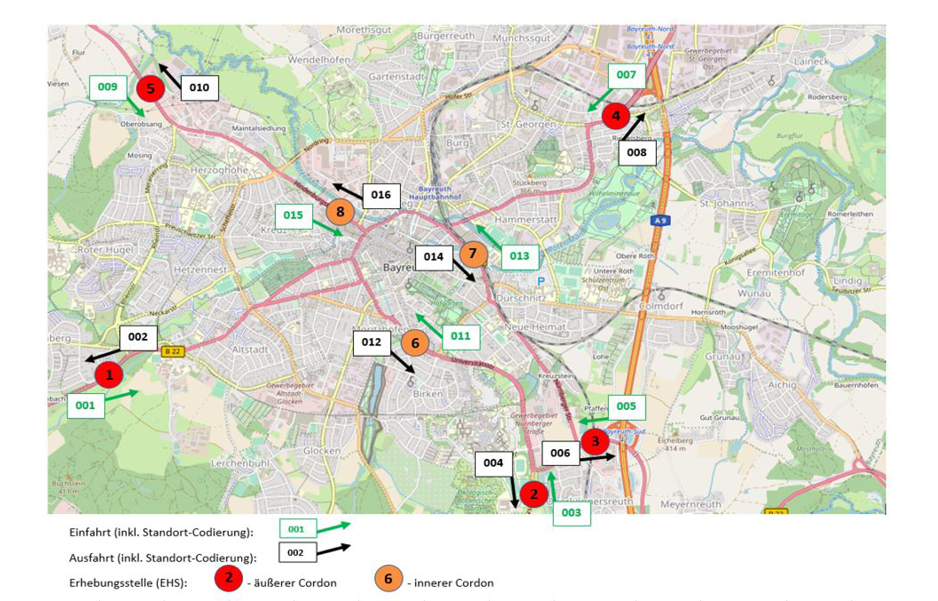 Example license plate recognition – outer + inner cordon
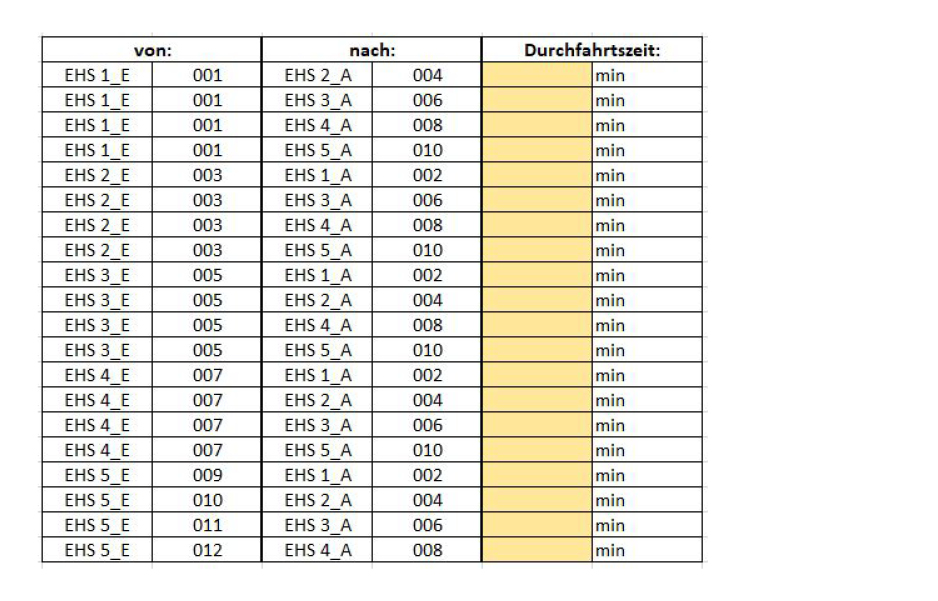 Individually selectable transit times
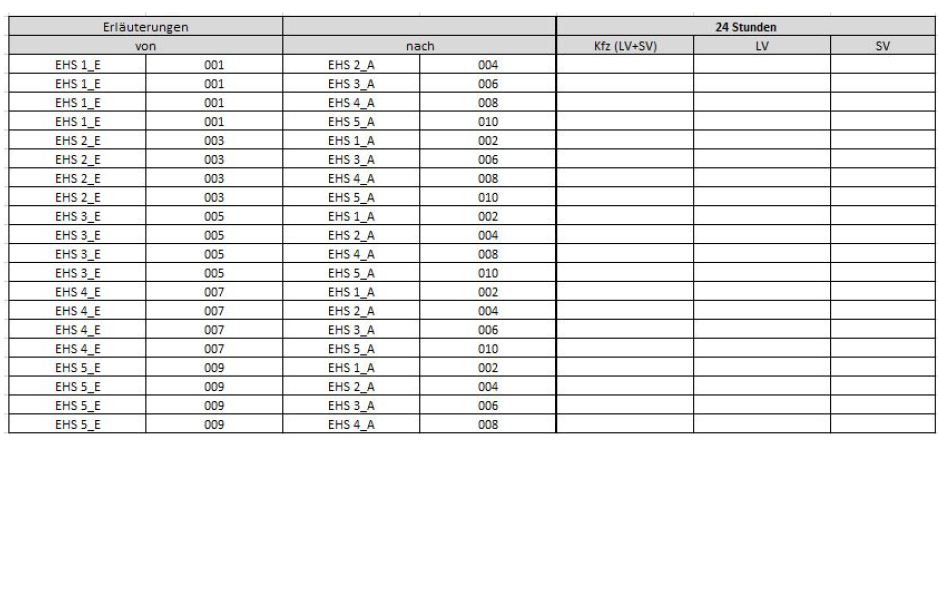 Sample evaluation license plate recognition table form
If you have any further questions on this subject, please contact us, we will be happy to answer your questions.
Traffic Survey
The field of traffic surveys encompasses such a broad spectrum, that a comprehensive summary cannot be given in a few lines. We would be happy to work out an individual solution for your specific project including preparation, implementation and analysis of the data.Let us know your requirements